

What the Study Found
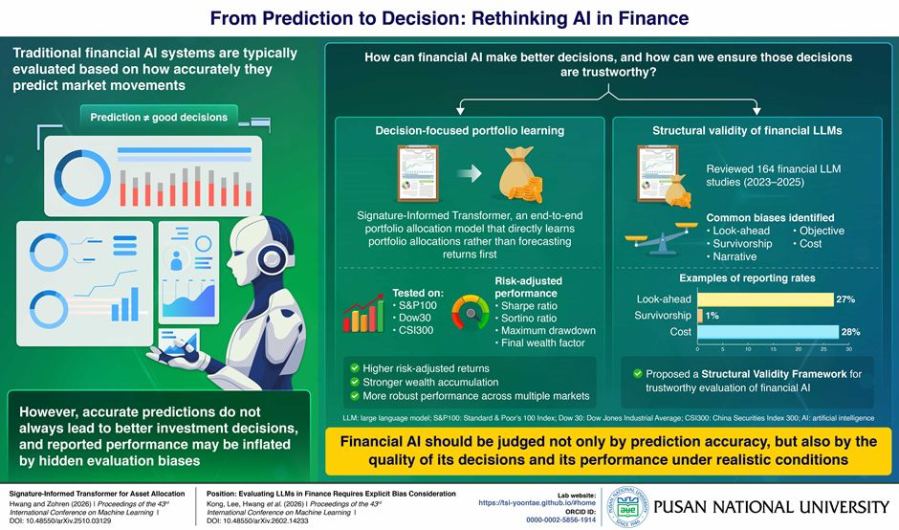
- A model built to choose portfolios, rather than to predict prices, earned more return per unit of risk than an even split: 0.6717 against 0.5759.
- Splitting the money evenly across the stocks beat all eight of the prediction-led systems, none of which matched it for return per unit of risk.
- Remove the instruction to limit losses and that same risk-adjusted score falls from 0.6717 to 0.5691, the biggest drop from any single change tested.
- Across 164 finance papers using large language models (LLMs), none of five result-inflating flaws was mentioned in more than 28% of them.
Somewhere in the results tables of a machine learning paper about portfolio construction sits a humbling number. Tested on a 40-stock slice of the S&P 100 over 2020 to 2024, the strategy that beat every deep learning forecaster in the study was also the least clever one available: divide the money evenly across the stocks, then leave it alone. Eight AI market forecast architectures, several of them current favorites in the time series literature, were trained on the same price history and had their predictions passed to a portfolio optimizer. All eight of them, beaten by the even split.
That result is the setup for an argument made by two papers out of Pusan National University in South Korea, both peer reviewed for the International Conference on Machine Learning in 2026 and both circulating publicly as arXiv preprints. Their claim is that financial AI has been optimizing the wrong thing all along: prediction accuracy and decision quality are not the same target, and a system can be very good at the first while being no use at all on the second.
The first paper, by Yoontae Hwang at Pusan and Stefan Zohren at the University of Oxford, proposes a model called the Signature-Informed Transformer (SIT), and its fix is structural rather than cosmetic. Conventional pipelines run in two stages: a network predicts the next period’s returns, and those predictions are handed to an optimizer that turns them into portfolio weights. SIT collapses the two, mapping market data straight to weights and training on a single objective, the conditional value at risk of the resulting portfolio, which is (in plain terms) the average size of the losses in the bad tail. It also feeds on a mathematical object called a path signature, whose second-order terms encode the signed area between two price paths, and that signed area turns out to be a clean measure of which stock tends to move first.

What Training for the Decision Bought
So does it work? On that 40-stock universe SIT posted a Sharpe ratio of 0.6717, against 0.5759 for the even split and 0.4901 for the best of the deep learning forecasters, and widening the universe to 50 stocks pushed it to 0.7715 while the best forecaster there managed 0.5315.
Strip the risk objective out and retrain, and the same architecture falls to 0.5691, which is the ablation that matters: the gain is coming from what the model is asked to optimize, not from having a bigger network. Worth saying, though, that none of this is money. These are historical backtests on daily prices; the models trained on 2000 to 2016, validated on the three years after that and tested on the five that followed. A backtest is a claim about what would have happened under the paper’s own assumptions rather than a record of what did.
Hwang, who moved to Pusan from Oxford in 2025 and now runs a lab there on asset allocation and market simulation, states the conclusion carefully. “Our findings indicate that future financial AI systems may need to shift their focus from maximizing prediction accuracy to optimizing decision quality,” he says.
Five Ways a Backtest Can Flatter Itself
The second paper turns the question around and asks whether the reported successes of financial AI can be believed at all. Hwang wrote it with Yaxuan Kong, Hoyoung Lee and seven others, and it is a position paper rather than an experiment: the team read 164 main conference papers on large language models (LLMs) in finance published from 2023 to 2025, then counted how often each of five recurring biases was so much as mentioned. Look-ahead bias, where a backtest uses information that did not exist at the time, came up in 26.8% of them. Survivorship bias, where the delisted and the bankrupt fall out of the sample and take the worst outcomes with them, appeared in 1.2 percent. Narrative bias, objective bias and cost bias round out the list, and no single one of the five was discussed in more than 28% of the papers reviewed.
Which makes the fifth of those biases uncomfortable company for the first paper. Cost bias is the habit of reporting gross performance while assuming trades are free, and you can see where this is going: SIT’s headline table is computed without transaction costs. The paper does sweep them separately, mind, and going from zero to 10 basis points per-dollar-traded hits the Sharpe ratio by about 0.03 to 0.04.
Nor is SIT the winner everywhere. On a 10-stock Dow Jones universe a plain global minimum variance portfolio edged it on Sharpe, 1.0394 against 1.0312, and the paper never says whether its index constituents were rebuilt at each date or simply taken as they stand today, which is precisely the survivorship question the companion paper asks authors to answer.
The remedy the second paper offers is unglamorous. It proposes a Structural Validity Framework: a pass or fail checklist covering point-in-time data, universes that keep their failures, uncertainty a model is allowed to express, and costs that show up in the primary metric rather than a footnote. Of the 50 practitioners who finished the survey, half (25 of them) reckoned the absence of exactly such tools was the biggest obstacle to fixing any of it. Pusan’s press release, meanwhile, closes on AI-powered flight simulators for markets, where virtual investors would let institutions and regulators stress test policy before real savings are exposed; neither paper makes that proposal.
What the two papers share is a refusal to take a good number at face value, which is an important thing for a field to discover about itself. If the first is right that a model should be trained on the decision rather than the forecast, and the second is right that most published results cannot yet show they would survive contact with a trading desk, then the question worth asking of the next leaderboard is not which architecture won, but which of the numbers anyone can still believe once the costs, the delistings and the calendar have been put back in.
- Study type: Computational modeling study with out-of-sample historical backtest, paired with a companion position paper and literature review; both peer reviewed for the 43rd International Conference on Machine Learning, 2026, and posted publicly as arXiv preprints.
- Sample size: Seven equity universes of 10–100 stocks drawn from the S&P 100, DOW30 and CSI 300 indices, on daily prices. Companion paper: 164 conference papers reviewed, plus 112 survey respondents of whom 50 completed all questions.
- Model: Signature-Informed Transformer, a decision-focused policy mapping truncated path signatures and cross-asset signature attention directly to long-only portfolio weights, trained solely by minimizing the portfolio’s conditional value at risk.
- Inputs and assumptions: Daily prices licensed from Wharton Research Data Services. Long-only, fully invested, monthly rebalancing, zero risk-free rate. Headline results assume zero transaction costs; frictions of 0–10 basis points appear only in a separate sensitivity sweep.
- Time horizon: Trained on 2000–2016, validated on 2017–2019, tested on 1 January 2020 to 27 December 2024, a window spanning several market regimes.
- Funding / conflicts of interest: Not reported. Neither paper carries a funding statement; the press release declares none. The companion paper states its views are those of the authors and not of BlackRock, Inc.
- Data availability: Model code released via an anonymized repository link; the companion paper’s bias dashboard and checklist are on GitHub. Underlying price data is licensed and not redistributed.
- Main limitation: Author-stated: tested on equity data only, with extension to higher-frequency, global and multi-asset markets left to future work. Not author-stated: the paper never says whether index constituents were point-in-time or survivor-conditioned.
Reference
Hwang, Y., & Zohren, S. (2025). Signature-Informed Transformer for Asset Allocation (Version 3). arXiv. https://doi.org/10.48550/ARXIV.2510.03129
Kong, Y., Lee, H., Hwang, Y., Lopez-Lira, A., Levy, B., Mehta, D., Wen, Q., Choi, C., Lee, Y., & Zohren, S. (2026). Evaluating LLMs in Finance Requires Explicit Bias Consideration (Version 1). arXiv. https://doi.org/10.48550/ARXIV.2602.14233
Frequently Asked Questions
Why does it matter whether an AI predicts markets accurately or picks portfolios well?
It matters whether an AI predicts markets accurately or picks portfolios well because the two are different jobs, and a system can be good at one while being no use at the other. Small errors in a return forecast get amplified once an optimizer converts them into portfolio weights, so a model tuned to minimize prediction error can still produce unstable holdings. Training the model on the allocation decision itself, rather than on the forecast, is what the Pusan researchers argue for.
Is it true that a simple equal-weighted portfolio beat the deep learning models?
It is true that a simple equal-weighted portfolio beat the deep learning models, on the universe highlighted here. Across a 40-stock slice of the S&P 100, splitting the money evenly produced a higher Sharpe ratio than any of the eight forecasting architectures the researchers tested. That comparison comes from a historical backtest covering 2020 to 2024, not from live trading.
How does a path signature actually help a model spot links between stocks?
A path signature helps a model spot links between stocks by summarizing the shape of a price path rather than just where it ended up. Its second-order terms encode the signed area between two paths, which is a compact measure of which of the two tends to move first. The Signature-Informed Transformer uses that quantity to adjust how much attention one stock’s data pays to another’s.
What is stopping published financial AI results from being trusted?
What is stopping published financial AI results from being trusted, on the argument of the second Pusan paper, is that five recurring biases go largely undiscussed. Reviewing 164 main conference papers from 2023 to 2025, the authors found no single bias mentioned in more than 28% of them, with survivorship bias appearing in 1.2 percent. Their proposed remedy is a pass or fail checklist covering point-in-time data, delisted firms, uncertainty and trading costs.


Cite This Page