

What the Study Found
- Breastfeeding rates vary from 22% to over 90% across US counties, with the Gulf Coast and Appalachia lagging badly.
- A spatially aware model explained 85.2% of county-level variation, versus 64.1% for a conventional national regression.
- Education and race operate nationwide, but disability’s effect is intensely local, ranging from -10.3 to +8.2 percentage points.
- Even after adjusting for income, race, and education, persistent regional baselines suggest unmeasured cultural and institutional factors.
Twenty-two percent at the bottom. More than ninety at the top. Those are the county extremes for breastfeeding initiation in the United States, drawn from birth certificates filled out at hospital discharge for every baby born in 2018 and 2019, and the gap between them is wider than the gap between many countries. The national figure sits at just under 79 percent, which is the sort of number that gets quoted in a press briefing and describes almost nobody.
Tony Grubesic has been circling this problem for about a decade. A public policy professor at the University of California, Riverside, he has published repeatedly with Kelly Durbin, a childbirth educator now based in Auckland, on where breastfeeding support actually exists: which counties have lactation consultants, which have a La Leche League chapter within driving distance, which have neither those nor the broadband to make telelactation a realistic substitute.
Whether the geography of support shows up in the geography of outcomes required something better than the standard toolkit. A conventional regression asks one question of the whole country at once: does having more college graduates in a county mean more newborns get breast milk before they go home? It answers yes, explains about 64 percent of the variation, and assumes that the answer holds with equal force in eastern Kentucky and suburban Seattle.

Grubesic and his colleagues, Wei Kang and Edward Helderop at UCR, working with Durbin, did not accept that assumption. Their paper, published this month in PLOS Global Public Health, uses multiscale geographically weighted regression, which is a mouthful, and worth unpacking.
When One Model Is Really Three Thousand Models
Picture a separate small regression run for every county, nearby counties weighted more heavily than distant ones. That is ordinary geographically weighted regression, around since the late 1990s. The multiscale version adds the crucial part: each variable finds its own natural neighborhood size. Education might operate nationally, the same everywhere. Disability might operate across a cluster of adjacent counties and nowhere beyond. The model works out the scale rather than being told.
The fit rose from 0.641 to 0.852. More telling than the headline number: the spatial clumping in the leftover error, the reliable tell that a model is missing something structural, essentially disappeared. Moran’s I of the residuals fell from 0.4067 to 0.0014. Whatever geography had been doing to the old model, the new one absorbed it.
“Furthermore, the study demonstrates that applying advanced spatial statistical modeling significantly outperforms traditional statistical methods, offering public health officials a precise, data-driven roadmap for deploying cost-effective community interventions where they are needed most,” Grubesic said.
The Variables That Refuse to Hold Still
Some findings did not budge across the map. Education tracks positively with initiation nearly everywhere, barely any regional wobble; a one standard deviation rise in residents holding a bachelor’s degree corresponds to roughly 1.6 percentage points more initiation. The share of Black residents tracks negatively everywhere, around 2.6 points down per standard deviation, a pattern with a long documented history behind it that the model can measure but cannot explain. Urbanicity mattered less than the folklore suggests: significant, yes, but under a percentage point, which is close to nothing.
Then things get local, and considerably stranger. Take disability prevalence. Across a broad band running through Arkansas, Tennessee, Missouri, Illinois and Kentucky, and again in Virginia, and again in Oklahoma and south Texas, higher county disability rates go with sharply lower breastfeeding initiation, in places by more than ten percentage points. Yet in two small clusters, one straddling the Alabama and Georgia line, the other spanning eastern Arkansas into northeastern Louisiana and western Mississippi, the relationship inverts. Higher disability prevalence, higher initiation, by as much as 8.2 points. The neighborhood size the model settled on for this variable was roughly four dozen counties, which is to say: whatever is happening, it is happening at the scale of a few counties “talking” to each other, not a region.
Grubesic and colleagues don’t pretend to know why. They note that the census measure lumps cognitive, ambulatory, vision, hearing and self-care difficulties into a single aggregate, so the contrasting signals could be different populations entirely. Local health programs, or something the researchers call community-level resilience, may be doing work the data can’no’t see. What are those counties doing differently, the paper asks, and then declines to answer.
Hispanic population share produced a comparable puzzle. It associates positively with initiation, but chiefly in the Northeast, the mid-Atlantic and parts of the Southeast, and not in the West and Southwest, where Hispanic populations are far larger. The authors offer two hypotheses without choosing. Subgroups are distributed unevenly, with Puerto Rican, Dominican and Central American communities concentrated in the Northeast against Mexican-origin populations in the West, and infant feeding norms differ across those groups. Acculturation may also matter, since recently arrived immigrant mothers have consistently shown higher breastfeeding rates than US-born counterparts.
Female-headed households behaved even more locally, with a neighborhood of just 144 counties, negatively so in the Upper Midwest, the Mississippi Delta, Appalachia and eastern North Carolina. The relationship showed up in counties with both high and low prevalence, so it is not simply a matter of how many. Meanwhile two variables that looked solid in the conventional model evaporated in the new one: the share of professional and managerial workers, and the Gini coefficient, both significant nationally and then significant nowhere locally once multiple-testing correction was applied.
There are limits. Michigan had to be dropped because the state reports through agency districts that sometimes bundle several counties together; so did Alaska, Hawaii and the territories. The covariates come from 2013 to 2017 census estimates, staggered before the birth data on purpose to avoid circularity, but staggered nonetheless. And this is county-level analysis, so the ecological fallacy is always lurking: none of it describes what any individual mother did, or why.
Where the Map Points Next
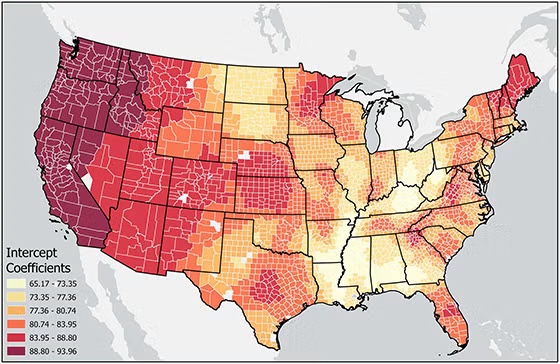
Strip out every modeled variable and one map remains, the intercepts, showing what baseline initiation would be in each county if all the measured factors sat at their national averages. It is not flat. Higher baselines cluster along the Pacific Coast, through parts of the Mountain West, across the Northeast and, oddly, in central Texas. Lower ones concentrate in the Gulf Coast and Appalachia. That residual pattern is the shape of everything the model could not measure: cultural norms, institutional trust, whether the local hospital has anyone on staff who knows what to do at three in the morning when a first-time mother cannot get a latch.
The interventions the paper recommends are unglamorous and cheap by health policy standards. More Baby-Friendly hospitals, meaning board-certified lactation consultants on staff and the WHO’s ten steps worked through. More peer support, in person where possible, online where distance makes it impossible. Expanded WIC eligibility, stripping the income restriction from mothers seeking breastfeeding help. None of it is new advice. What’s new is a defensible answer to the question that has stalled it for years, which is not what to do but where.
Grubesic argues the county-level view deepens understanding of the structural and geographic barriers to a practice that remains, in his framing, among the most effective preventive health measures available for reducing infant mortality and protecting mothers against chronic disease. Whether any state health department reorganizes its budget around a set of bandwidth parameters is another matter. But the two-county cluster on the Alabama-Georgia line, where disability and breastfeeding move together in the direction nobody predicted, is sitting there in the data, waiting for someone to drive out and ask.
- Study type: Cross-sectional ecological study; peer-reviewed, published in PLOS Global Public Health (July 2026)
- Analytic approach: Multiscale geographically weighted regression (MGWR) with exploratory spatial data analysis, benchmarked against a global OLS model
- Outcome measure: County-level breastfeeding initiation rate, defined by CDC as any breast milk or colostrum between delivery and hospital discharge
- Sample size: 3,011 counties (95.8% of US counties), covering births in 2018–2019
- Data sources: CDC birth certificate data, California Newborn Screening data, and 2013–2017 ACS 5-year estimates for 13 socioeconomic predictors
- Geographic coverage: Contiguous 48 states excluding Michigan; Alaska, Hawaii, and US territories also excluded
- Funding / conflicts of interest: No specific funding received; authors declare no competing interests
- Main limitation: Ecological design means county-level associations cannot be attributed to individual mothers’ behavior, and sub-county variation is invisible
Reference
Grubesic, T. H., Kang, W., Durbin, K. M., & Helderop, E. (2026). Spatial inequalities in breastfeeding initiation in the United States: A multiscale analysis of county-level determinants. PLOS Global Public Health, 6(7), e0005659. https://doi.org/10.1371/journal.pgph.0005659
Frequently Asked Questions
Why do national breastfeeding statistics hide so much?
National breastfeeding statistics hide so much because they average across counties whose initiation rates range from 22 percent to more than 90 percent. The United States figure of roughly 79 percent accurately describes the country as a whole and almost none of its individual communities, which makes it a poor basis for deciding where to spend limited public health money.
How does geographically weighted regression actually work?
Geographically weighted regression works by running a separate local model for each location instead of one model for the entire study area, giving nearby observations more weight than distant ones. The multiscale version used in this study goes further by letting each variable find its own neighborhood size, so a factor like education can operate nationally while a factor like disability operates across only a few dozen counties.
Is it true that urban mothers breastfeed less than rural ones?
It is true that urban residence associates with slightly lower breastfeeding initiation, but the effect is far smaller than commonly assumed. In this analysis a one standard deviation increase in urban population share corresponded to a decrease of less than one percentage point, meaning urbanicity on its own explains very little of the national variation.
What’s stopping public health officials from acting on findings like these?
What stops public health officials from acting on findings like these is partly that county-level data cannot tell you what any individual mother did or why, a problem known as the ecological fallacy. The analysis identifies communities where support is likely to pay off, particularly across Appalachia and the Gulf Coast, but the specific local barriers within those communities still have to be investigated on the ground.
Could better breastfeeding support really change infant health outcomes?
Better breastfeeding support could change infant health outcomes because initiation is associated with lower infant mortality and reduced risks of sudden infant death syndrome, obesity and type 2 diabetes, with mothers seeing reduced risks of breast and ovarian cancers. The strategies this study recommends, including Baby-Friendly hospital certification, peer support groups and expanded WIC eligibility, are inexpensive relative to most health interventions.


Cite This Page