What the Study Found
- Extreme heat seasons have expanded across just over half the world’s land area since the 1980s.
- The expansion is lopsided: some regions gain more heat in spring, others gain more in fall.
- Heat now lingers later into fall in the western US, eastern China, northern Africa and eastern Europe.
- Rising average temperatures alone cannot explain the lopsided shift, pointing to regional factors instead.
For 113 days straight in the summer and fall of 2024, Phoenix never dropped below 100°F, and the streak was followed by 21 more days in a row of record highs in October. That kind of heat is not supposed to happen in October. A new global study finds that ordinary warming cannot explain why extreme heat is spreading into new months of the year, and that the spread runs in only one direction in almost every place it shows up. Not more heat everywhere, evenly, but sideways: into spring in some regions, into fall in others, as if the calendar itself were being nudged off its hinges.
Extreme heat has become more common; that much is well documented, and increasingly lived. But when it shows up during the year is a separate question, one researchers have largely left alone.
Catherine Ivanovich, a climatologist at NASA’s Goddard Institute for Space Studies, and her colleagues built their own definition of an extreme heat season instead of relying on the calendar’s usual boundaries. For every patch of land on six continents, they found the three consecutive months in the 1980s when daily temperatures were most likely to land in the hottest five percent on record, and called that stretch the local heat season. They did this twice over, once for ordinary dry heat and once for a humid heat measure that folds moisture, sunlight and air temperature into a single number closer to what the body actually feels. Then they asked a harder question: 45 years later, are extreme heat days still landing inside that same three month window, or have they started spilling over the edges?

The windows have not held. Extreme dry heat seasons have expanded significantly across just over half the world’s land area, 50 percent, and extreme humid heat seasons across just under half, 48 percent.
A Lopsided Expansion
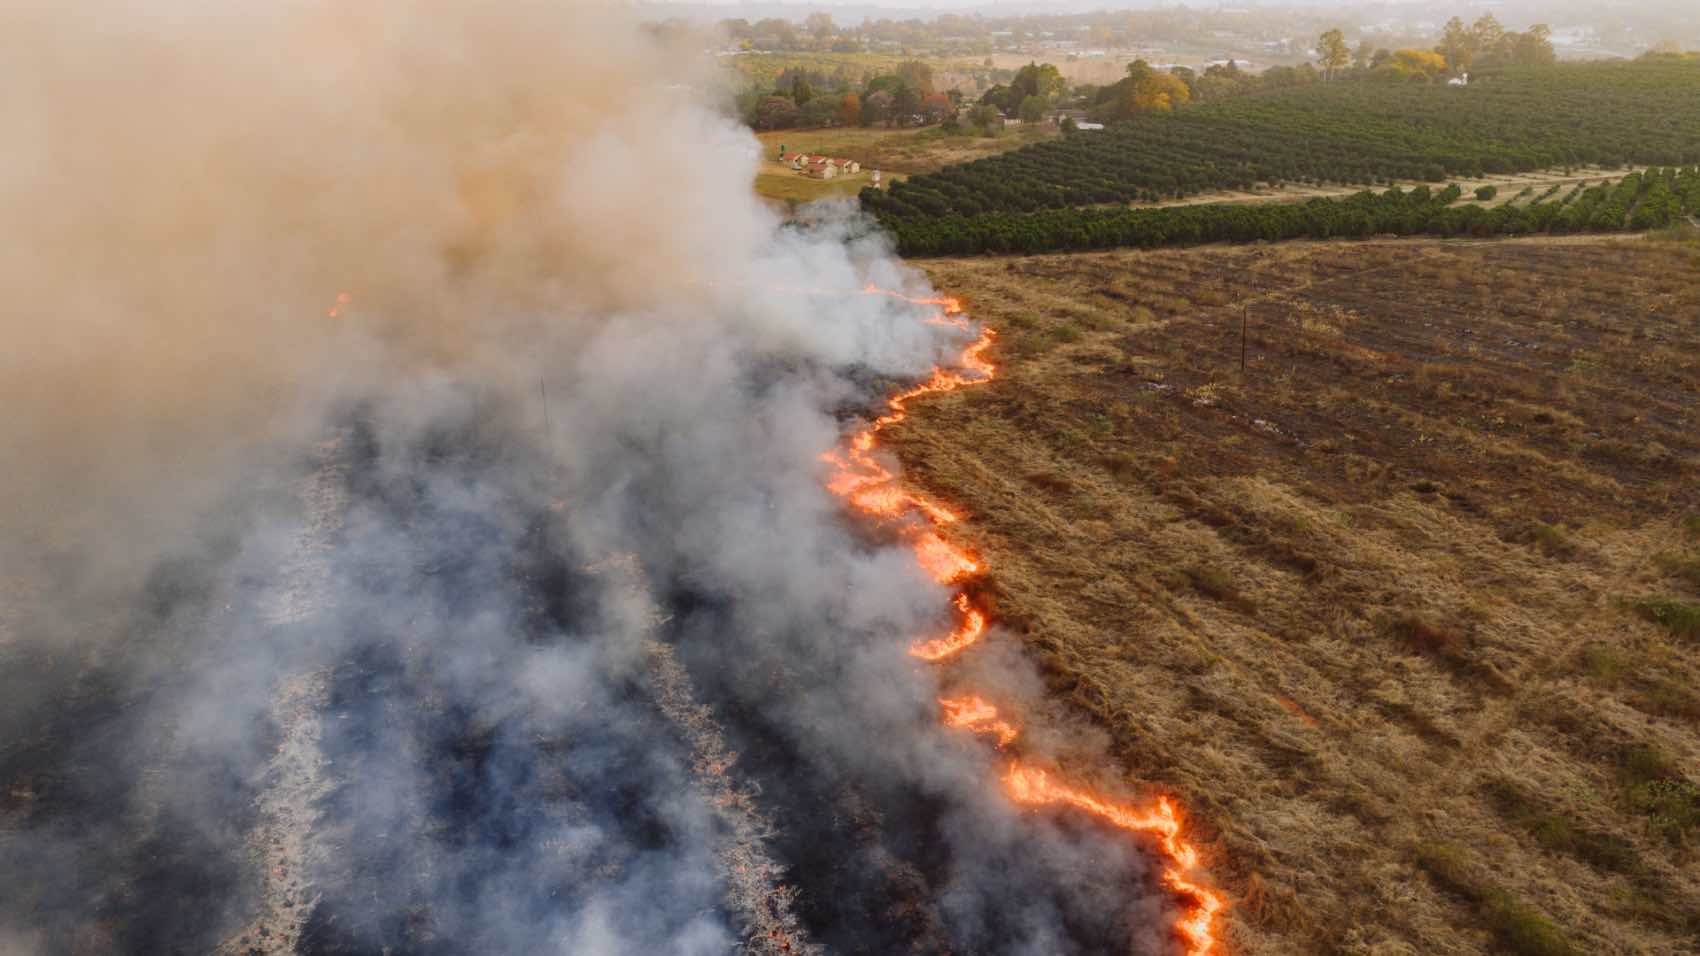
In the western United States, eastern China, northern Africa and eastern Europe, the growth has run mostly into the months after the traditional heat season, meaning heat that used to end on schedule now drags on. In western Europe, southern Africa and northwestern India, it has run the other way, pushing further into the months before the season used to start. Neither direction is uniformly worse, but each demands something different: a region gaining fall heat needs its wildfire and hurricane planning to overlap with heat planning, while one gaining spring heat needs cooling centers open before anyone thinks to ask for them.
“In some places, we have a larger expansion of extreme heat during the spring, before the traditional heat season starts. In other places, there’s a much faster expansion of the heat season into fall,” says Ivanovich. It is a small thing to say aloud, but it means an entire discipline built around bracing for summer now has to reckon with heat that no longer respects the difference between June and October.
Ruling Out the Obvious Explanation
The obvious explanation is simple: if average temperatures are rising everywhere, then crossing an old extreme heat threshold should get easier in every month, including the ones just outside the historical season, and the shoulder season creep would just be warming doing what warming does. To test that idea, the team built a synthetic version of each location’s climate: take the 1980s baseline, add exactly the amount of warming that place experienced by the 2015-2024 decade, and see what calendar of extreme heat that simple shift alone would produce. For most of the planet, that synthetic warm up explains the broad shape of the calendar well: only 14 percent of land areas show an overall pattern of dry heat extremes that a statistical test flags as genuinely different from the warmed up baseline, and 16 percent for humid heat. But zoom in on the specific asymmetry, the tilt toward spring in some places and fall in others, and the simple warming explanation falls apart: about 80 percent of land areas show shoulder season patterns that a bootstrapping test says the warmed up baseline could not have produced, rising to 99 percent among the places with the largest asymmetry. Phoenix is a clean example of the mismatch: the city’s median extreme dry heat day shifted 10 days later in the year, its median humid heat day shifted 5.5 days earlier, and neither shift is what a place simply getting warmer, evenly, all year, would be expected to produce.
None of this rests on a single dataset that might just be quirky. The team checked its findings against two independent climate datasets: the primary one built by NASA and called MERRA (short for Modern-Era Retrospective Analysis for Research and Applications), version 2, and a second built by the European Centre for Medium-Range Weather Forecasts (ERA5). The pattern held up in both.
The signal isn’t perfectly clean, either. The spread of Phoenix’s extreme heat dates barely changed, a statistically insignificant 7.5 days wider for dry heat and 4 days for humid heat. That’s a reminder that a shifting median and an unchanged spread can both be true of the same slice of data.
Ivanovich is careful not to oversell the result: extreme heat outside its usual season is rare almost by definition, rarer still when it is unprecedented, and rare events are hard to pin down statistically no matter how the numbers are sliced. “We can’t confirm what share of the signal is due to climate change using observations alone,” she says, though she adds that “it’s certainly the primary component of the story.”
Heat That Doesn’t Wait for Summer
The stakes are not abstract. In Maricopa County, home to Phoenix, 608 people died of heat related causes in 2024, and only 46 percent of those deaths came in July, the hottest month on the calendar, down from 64 percent of the county’s 645 heat deaths a year earlier. A shifting heat season also means a shifting collision course: in the western United States, a longer fall heat season now overlaps more with wildfire season, and in the Southeast it overlaps more with hurricane season, and Ivanovich notes that hazards arriving together or in quick succession “are much more dangerous and impactful than if these events happened in isolation.” None of that is captured by cooling centers and heat alerts still built around a summer calendar.
The next step, already planned, is to run the same comparison through climate models instead of historical records alone, trading 45 years of real weather for thousands of simulated years in which the same warming plays out again and again. If the models reproduce the same lopsided creep into spring and fall, that will be the strongest evidence yet that the seasons themselves, not just the thermometer, are being rewritten.
Reference
Ivanovich, C. C., Cook, B., & McDermid, S. (2026). Extreme Dry and Humid Heat Seasons Are Changing Asymmetrically. AGU Advances, 7(6). https://doi.org/10.1029/2026av002516
- Study type: Observational climate study, peer reviewed (AGU Advances, American Geophysical Union).
- Datasets: MERRA-2 global reanalysis (primary), cross-validated against a second reanalysis product, ERA5; six inhabited continents, 45 years of daily records (1980-2024).
- Comparison period: baseline decade 1980-1989 versus recent decade 2015-2024.
- Funding / conflicts of interest: NASA Postdoctoral Program Fellowship and a NASA-sponsored contract (ORAU-80HQTR21CA005) through ORAU; authors declare no conflicts of interest.
- Data availability: MERRA-2 and ERA5 records are both publicly available; analysis code is posted on GitHub and archived on Zenodo.
- Main limitation: Author-stated: shoulder-season extremes are rare by definition, limiting statistical power; the authors built a bootstrapping method to work around the small sample, calling it imperfect but the best available estimate from reanalysis data alone.
FAQ
Why does it matter if extreme heat shows up outside the usual season?
Extreme heat outside the usual season matters because people and cities are not ready for it. Before the season starts, bodies have not acclimated and cooling centers may not be staffed yet; after the season ends, heat piles onto weeks of accumulated strain, and alert systems built around a summer calendar may have already stood down.
What might be causing the lopsided pattern if simple warming does not explain it?
The researchers say regional factors likely fill the gap, though they did not test any of them directly in this study. Shifts in rainfall patterns, changes in land use such as irrigation and farming, and regional wind or pressure patterns are all candidates that could push heat extremes earlier or later in specific places, and identifying which ones matter where is the next phase of research.
How does dry heat differ from humid heat in this study?
Dry heat is measured with ordinary air temperature and tends to hit crops and ecosystems hardest, while the humid heat measure folds moisture, sunlight and air temperature together to capture what the body actually experiences, and it is the more dangerous of the two for people because damp air limits how well sweat can cool the skin. The two do not always shift in the same direction or by the same amount, which is part of why the researchers tracked them separately.
Could this kind of heat spread collide with other seasonal hazards?
Yes, and the researchers flag this as a growing concern. A longer fall heat season in the western United States now overlaps more with wildfire season, and in the southeastern United States it overlaps more with hurricane season, and hazards that arrive together tend to cause more damage than the same hazards spread apart.


Cite This Page